Can I export the contents of the various tab's grids to Excel or CSV (comma separated values) for documentation?
Synopsis
Each of the tabs in the "Objects" pane (bottom pane) has a grid which columns of properties. You can dynamically add specific properties that you're interested in to analyze, modify, and standardize. But you'd like to export the contents to Excel or a CSV (comma separated values) file to analyze and/or document further.
Can this be done with .rpt Inspector?
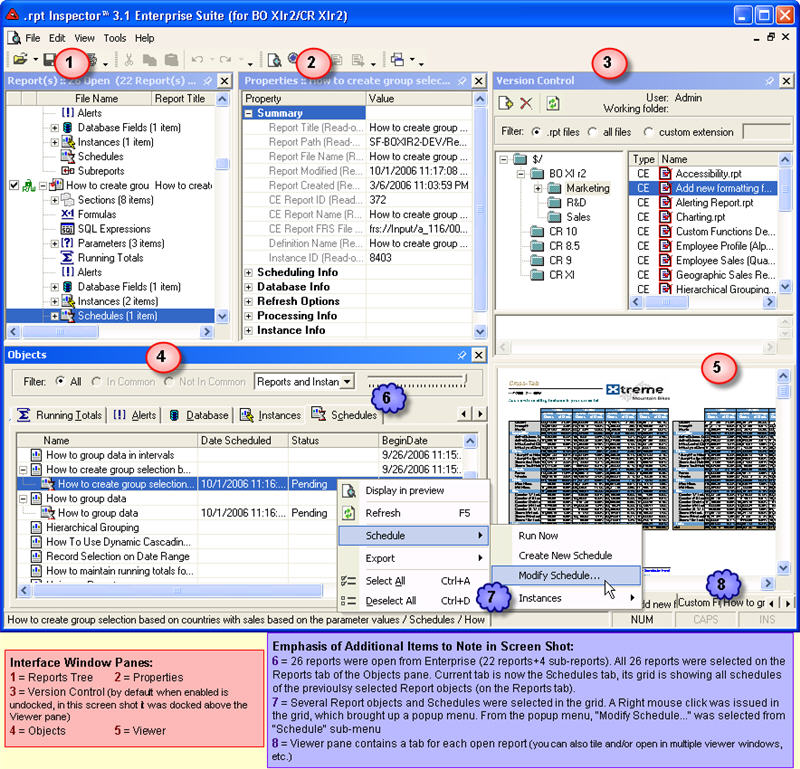
Click here for a visual explanation of the .rpt Inspector user interface
Click here for an explanation of tabs and the Objects pane
Solution
Yes you can!
The contents of each of the tab's (click here for an explanation of tabs and the Objects pane) grids can be exported to either Excel or a CSV (comma separated values) file.
When you export to Excel, the .XLS file created will look one to one as it does in the tab's grid. Meaning that if you've created groupings using our Drag and Group concept (click here for a step by step guide on dynamically adding columns and using the Drag and Group concept to create pivot like hierarchies) and rows are collapsed then they will be hidden in Excel, etc.
When you export to a CSV file, you'll only get the data but no formatting. Which means that you can then take this CSV file and create a Crystal Report from it, import in to Excel, or any other application that supports CSV file format and fine tune your own look and feel as well as information you're interested in seeing.
To export:
1. Go to the tab that contains the information you're interested in exporting (i.e. to see Database information you'd go to the "Database" tab, to see Formula information you'd go to the "Formulas" tab, to see Fonts or Colors or Graphics used in the design of the Crystal Report you'd go to the "Objects" tab, to see Schedule information you'd go to the "Schedules" tab, etc. -- click here for an explanation of tabs and the Objects pane)
2. Add to the tab's grid the columns of properties (click here for a step by step guide on dynamically adding columns and using the Drag and Group concept to create pivot like hierarchies) you're interested in exporting.
If you plan to export to Excel, and you've created grouping(s), you may wish to first expand all the groupings before you export.


Otherwise, all collapsed grouping rows will be exported to Excel as hidden and you'll have to unhide them manually in Excel.


To expand all grouping rows -- right click on one of the rows in the tab's grid and from the pop-up menu select "Expand All" or you can use the keyboard shortcut Ctrl+E
3. Right click on one of the rows in the tab's grid
4. From the pop-up menu, select the "Export" menu
5. In the "Export" menu, select either to export to "CSV" or "Excel"
6. Provide the location and file name for the exported file


